Power BI – Conditional Formatting Update
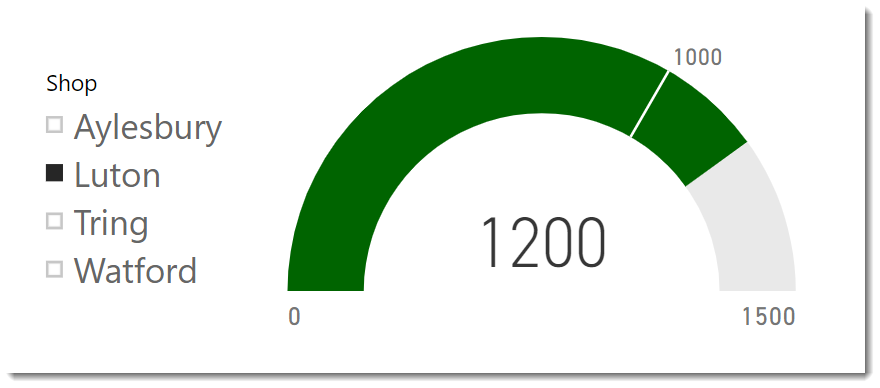
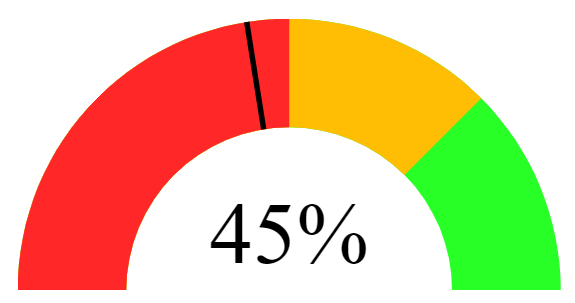
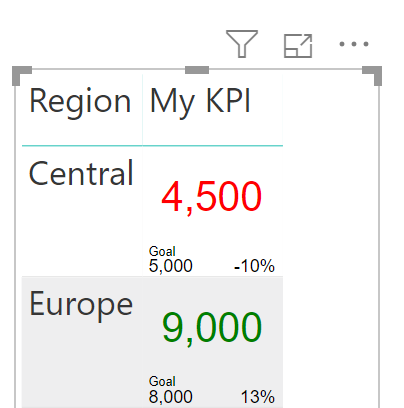
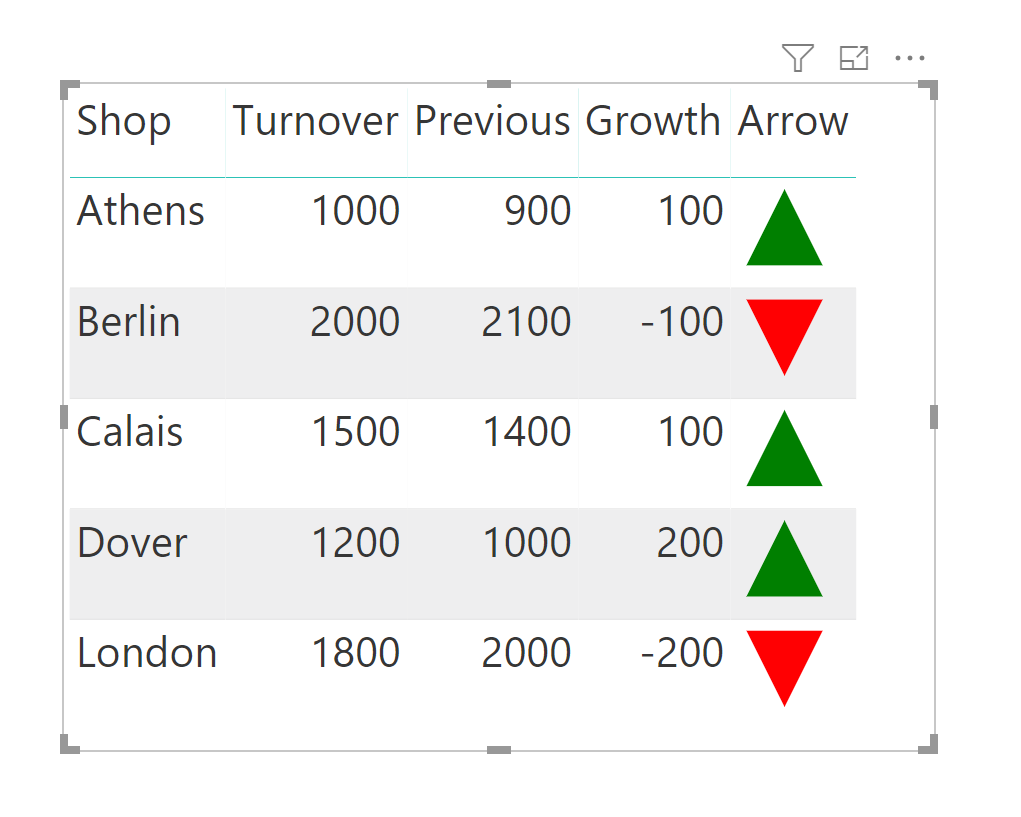
The June 2019 update for Power BI included a few updates for conditional formatting, for visual backgrounds, titles, cards and gauges. This post is my take on the updates and on how I prefer to do the logic behind choosing a colour. Full details of the June 2019 update can be found at https://powerbi.microsoft.com/en-us/blog/power-bi-desktop-june-2019-feature-summary/ Applying Conditional Colour Formatting This update...
