This post describes how to build a multiple step function in M using a parameter and using create function to build the function code.
In this post I will write a simple custom handwritten function to perform a calculation, which can then be used in your queries.
In this post I will look at the different options we have for summarising the data using grouping and pivoting with Power Query.
In this post I will document how to build an AI Builder object detect model. We will create the list of items to detect, upload images, identify each image and then train the model.
In this post I will introduce one of the most powerful parts of Power Query, joining tables. Its the vlookup part of Power Query.
This is the first post in a new series regarding Power Query in Flow. In this post I will cover the basics of connecting to SQL Server, filtering and sorting the data and finally adding calculated columns.
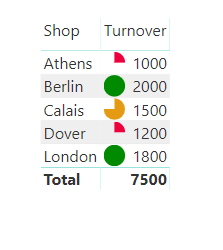
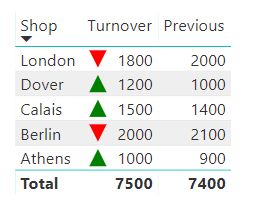
As part of the July 2019 update there were changes to conditional formatting. In this post I am going to cover adding to or swapping the built in icons using a theme file and some SVG.
This post is to support a video posted on YouTube regarding creating an adaptive card for Microsoft Teams using Microsoft Flow.
In July 2019 Power BI Desktop update they included new conditional formatting on table and matrix to include icons. These icons can be defined using SVG which is pretty cool. So this is a new post in my Power BI SVG series looking how we can use SVG icons in conditional formatting.
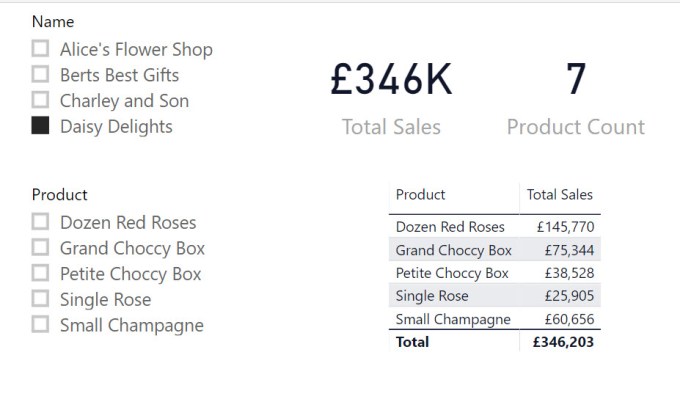
In this post I am continuing my campaign against bi-directional relationships. This is an introduction of the CROSSFILTER function which can be used to simulate the bi-directional relationship in a calculation.