Learn how to use Microsoft Fabric variable library values in Lakehouse shortcuts, update shortcut targets, and support dev, test, and production deployments.
Learn how to use Microsoft Fabric variable libraries in data pipelines for dynamic connections, workspace IDs, warehouse IDs, and deployment-ready configuration.
Learn how to access Microsoft Fabric variable library values in a notebook using notebookutils, direct references, and reusable naming conventions for deployment.
A personal review of 2025, covering Hat Full of Data blog traffic, YouTube growth, community speaking, and plans for more Microsoft technology content in 2026.
Learn how to create a Microsoft Fabric variable library to centralise configuration values for dataflows, notebooks, and pipelines across deployment stages.
Dataverse is the data store behind parts of Dynamics and lots of Power Platform projects. So Dataverse can contain vital business data that will be needed for reporting. In this post we are going to look at one method which is using copy job with Dataverse to copy across data in Microsoft Fabric. Scenario For this post we will look...
Direct Lake is the best way to build a semantic model on data in a Lakehouse or a Warehouse. We can then use Power BI to build reports and possibly even a make a Workspace App to deliver those reports to the business. So what permissions do the business users need to view those reports? This post will explore using...
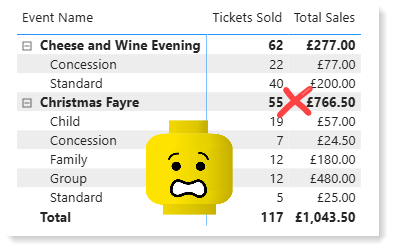
I recently had a request for totals in a Matrix to be shown for some columns and not for other columns. My solution was to use ISINSCOPE in a Matrix to work out which level of the matrix to choose what to return. Scenario At an event you sell tickets. So for the Cheese and Wine evening we can see...
Recently in a few Power BI projects and training courses we’ve needed to create a measure for counting active records based on start and end dates for a time period. This has varied from active projects, active employees to active contracts. All of them have had the common feature of start and end dates. Scenario Task Start End A 01-May...
A recent project made me reach out to Lewis Baybutt to scream “Help!, I need help getting with authentication for an Excel file in SharePoint in a Microsoft Fabric Notebook”. Yes all the delights of Excel and SharePoint in one project. So started the battle with understanding authentication, permissions and apparently a Notebook and Microsoft Graph is the way. The...