WarningThe code in this post stopped working at some point. But its okay, a video at https://www.youtube.com/watch?v=lfqPpUdtTss explains that you need to swap # with %23 when you specify colours in the SVG.
Series
This is part of a series on using SVG in Power BI. The series supports my session at Power BI Days in Mechelen, Belgium in April 2019.
- Introduction to SVG Basics
- KPI Shapes in Power BI
- Filling up with colour using SVG in Power BI
- Using Text in SVG
- Using SVG Rotate to create a dial in Power BI
- SVG Icons in Conditional Formatting
- Using a Theme to add SVG Icons
- Feb 2023 Update - 5 SVG Stars
As part of the July 2019 update there were changes to conditional formatting and I covered the use of SVG based measures to add icons in part 6 of this series. In this post I am going to cover adding to or swapping the built in icons using a theme file and some SVG.
Overview of Theme Files
Theme files are a JSON file with instructions for formatting your visuals. The formatting can include colours, fonts and now icons. Details of how to construct and use a theme file can be found in the links below.
https://docs.microsoft.com/en-us/power-bi/desktop-report-themes
https://powerbi.tips/tools/report-theme-generator-v3/
Adding New SVG Icons
Icons is a new section for the theme file. It is at the same level as the name. You need a name, url and description for the icon. I can see no evidence of the name or description being used. Please correct me if I am wrong.
The url can be SVG code in a similar format to the measures from previous posts. So in this example my first icon is a red quarter of a circle. Below is the SVG code for the shape.
| |
A simple theme file to create one extra icon would look like
| |
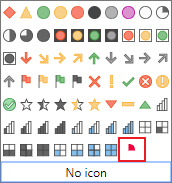
This adds a single icon to the icons available in conditional formatting. It will be listed at the end of the icon list.
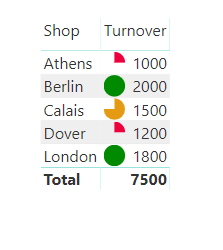
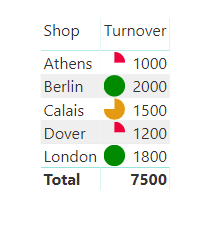
I then expanded the list of icons to cope with 25%, 50%, 75% and 100% going from red through amber to green.After applying the the theme to my report I created conditional formatting rules to a table to use my new icons.
| |

Conclusion
Adding a few extra icons to report is great. I am concerned that adding lots of complex icons will just make the report slow.
In Microsoft’s announcement they say you can replace existing icons using a theme file. For this you need the resourceKey for the icons. I have not been able to find a list of icons and the example they give didn’t work for me.