This post is to support my virtual introduction to Power BI session for London Reactor on 16th November 2020.
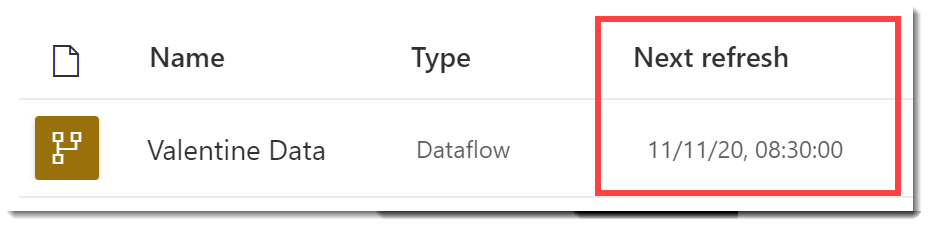
Most dataflows needs to have scheduled refresh setup so that the data will be up to date ready for the reports connecting to it.
Create a Dataflow is a great way to give your report writers reusable transforms that doesn’t require data logins for every report writer.
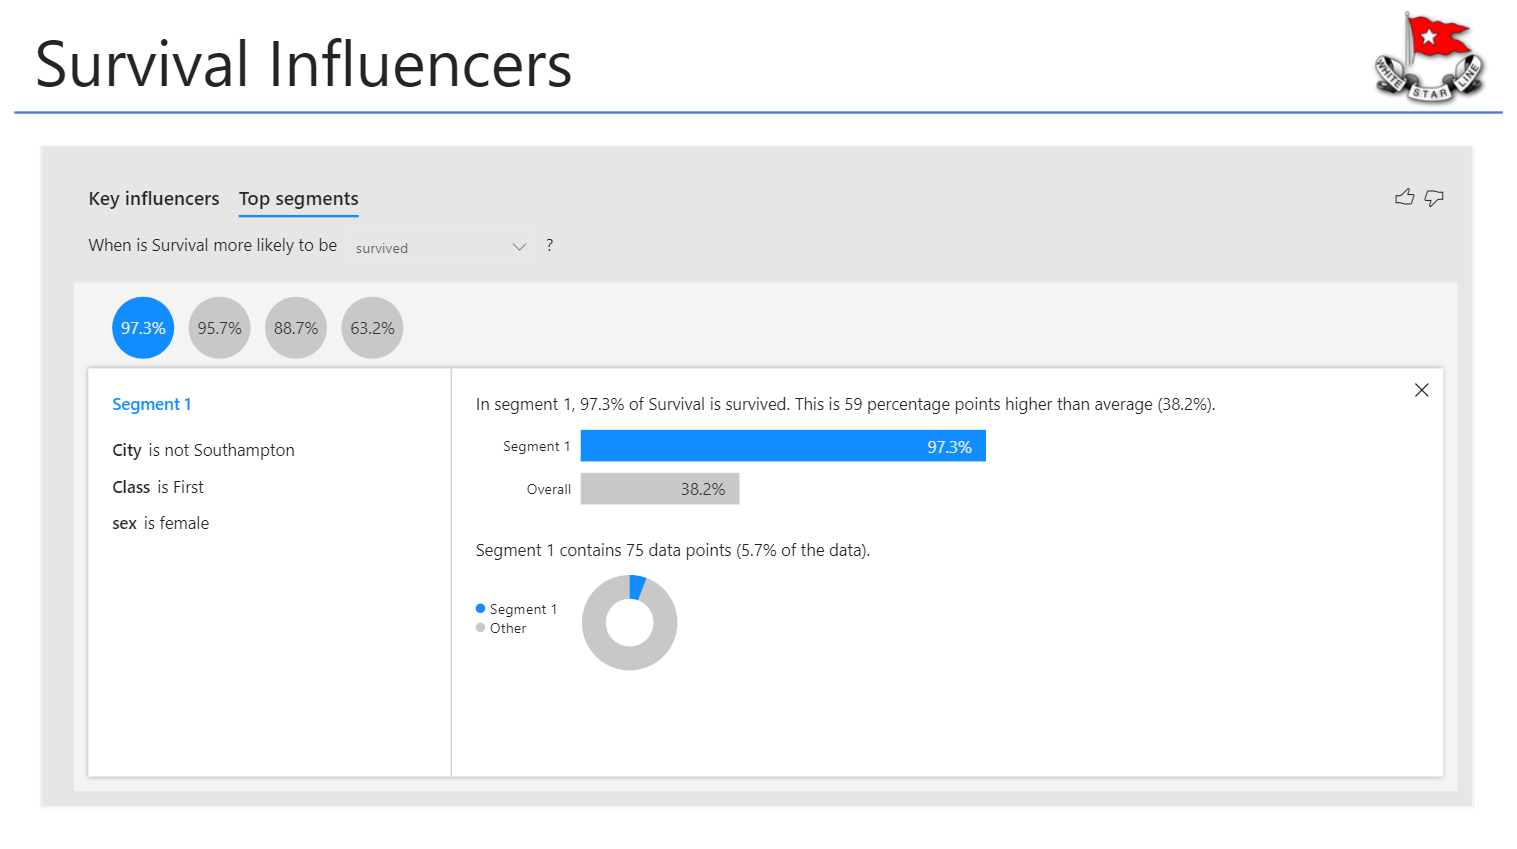
This is a post to support my session at the Reactor on 12th October 2020. The session was aimed at newcomers to Power BI and the AI visuals. Below is a link to the video on Reactor’s YouTube channel Data Sources The session uses 2 data sources, the passenger list for the Titanic and an Excel file to add some...
Here are links to resources I used for the Power BI Introduction session at London Reactor on Wednesday 2nd September 2020.
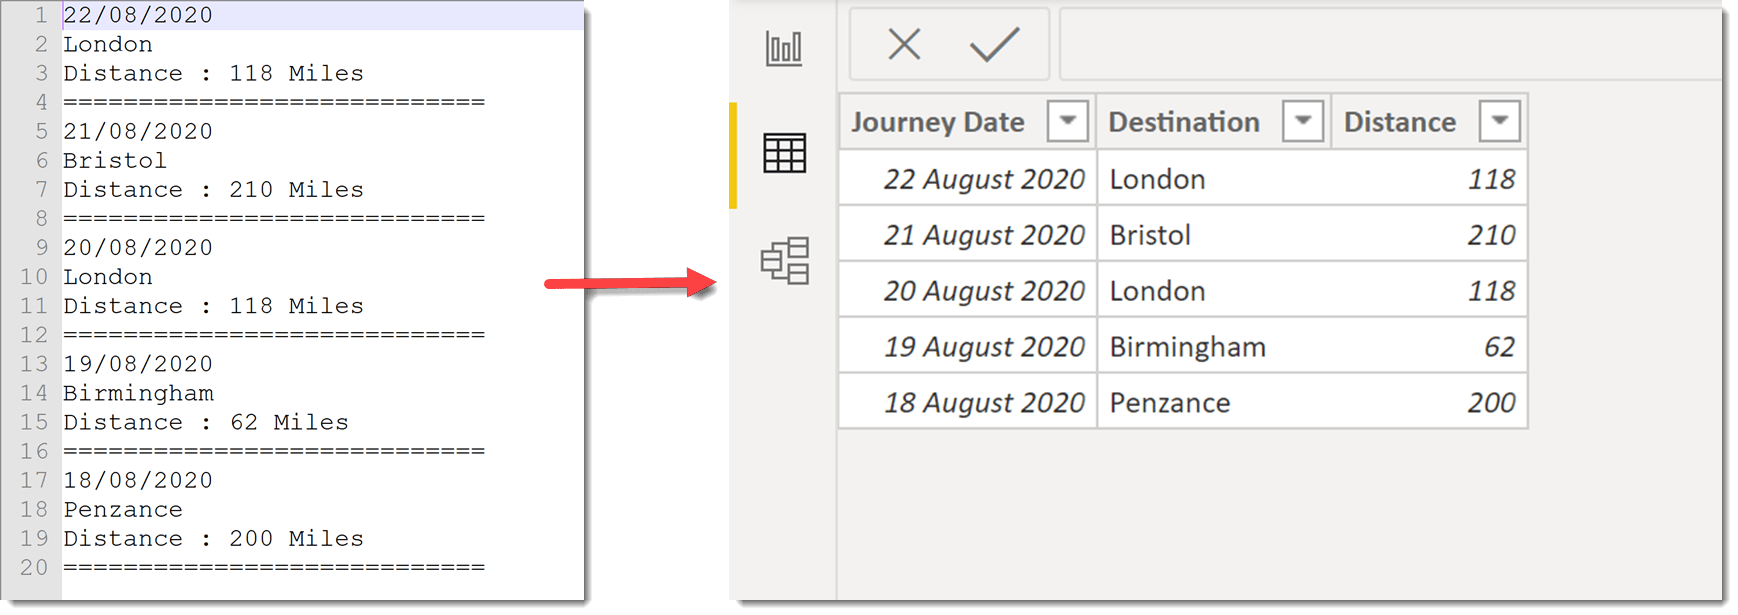
Import text using examples was introduced in the 2020 August update for Power BI. It writes the Power Query steps to transform a non-tabular text file into a table.
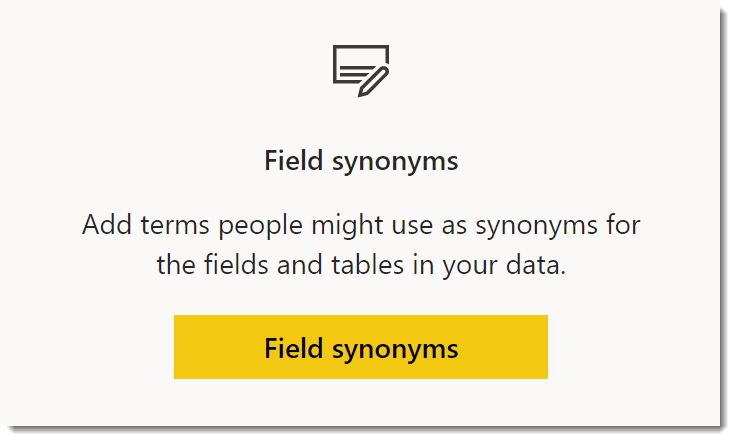
Q&A allows report readers to ask questions regarding the report data. Natural language interpretation can be improved by using Q&A synonyms.
At the end of July 2019 I decided to posting more regularly to my own blog and on the 5th August 2019 I posted my first video on YouTube. This post is to say thank you to anyone reading this and any other post or watching a video. I remember being highly amused when I got 25 subscribers and when...
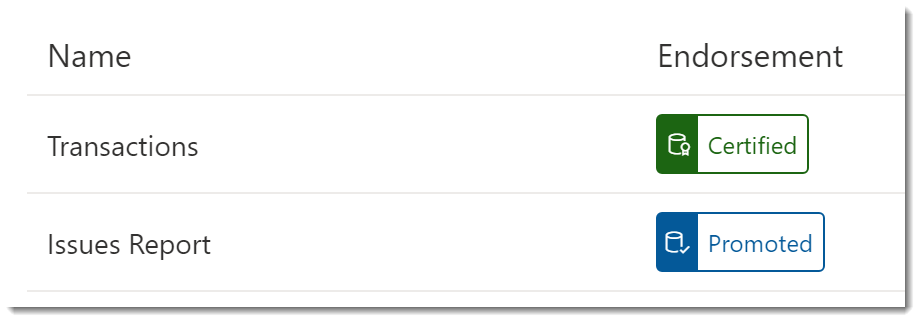
Connecting to an existing dataset is highly recommended if possible. To encourage report builders to select the right datasets you can endorse a dataset.
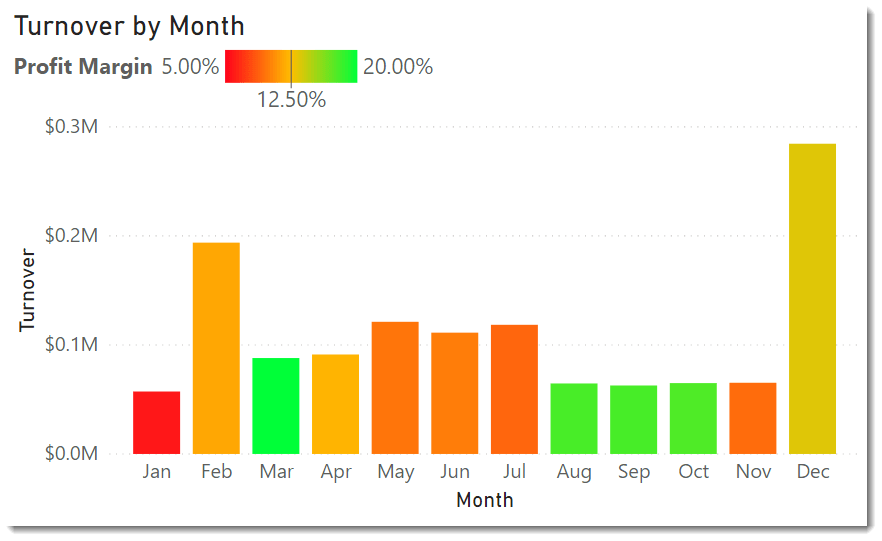
The July 2020 update to Power BI introduced a new feature of Gradient Legends to help annotate the colours used in a colour scale conditional formatting.