Lab 03 - Ingest Data using a Notebook
Notebooks are not a new invention, they are a well established tool for working with data using Apache Spark. In this lab we are going to create a notebook that does some minor transformations and then loads the data into a table.
This lab only covers the very basics, to learn more take a look at Notebooks n Microsoft Learn
Create the Notebook
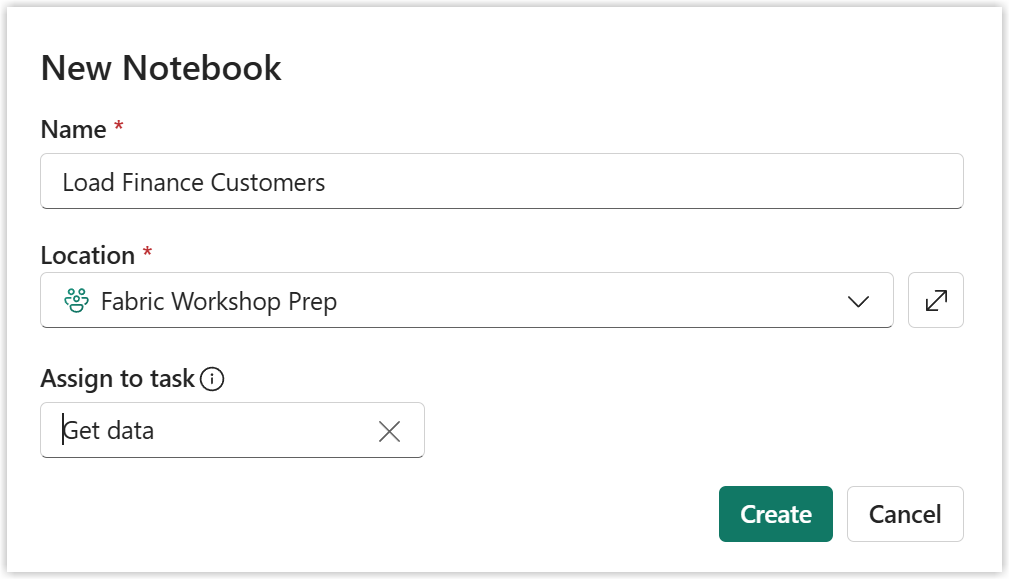
The notebook is getting data so it belongs in the Get Data task. Click New item on the Get Data task. From the items that appear on the right select Notebook.
A dialog will appear prompting you to name your notebook. Notebook_1 is not a good name. Future you will thank past you if you name things properly.
Notebooks are made up of blocks or Markdown and code. Markdown is great to document the notebook. Each code block can be run one at a time or all of them.
Connect Lakehouse
The notebook needs to be connected to the Lakehouse in order to access the files and tables.
Instructions
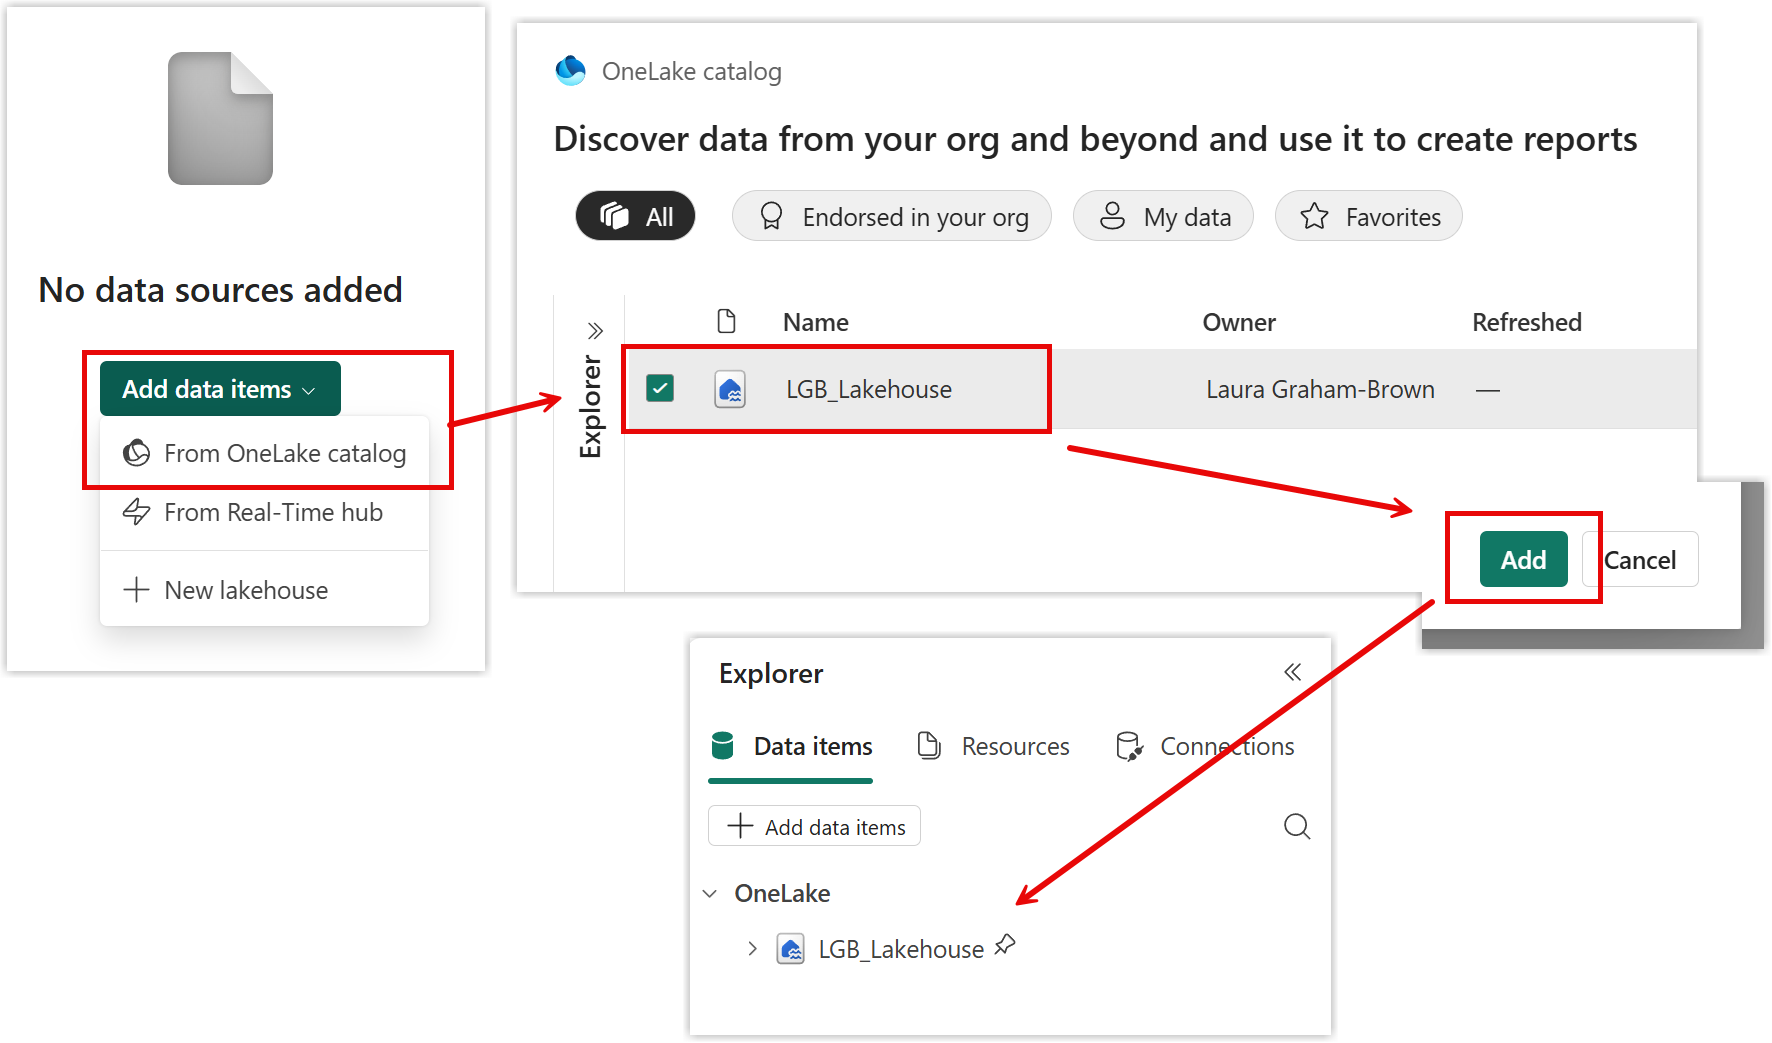
- In the explorer pane on the left hand side, click on Add data items.
- Select From OneLake catalog.
- From the list of lakehouses and warehouses select your lakehouse.
- Click Add
The explorer pane should now show your lakehouse.
Load a file into a dataframe
Notebooks can load data into a variable that is a dataframe. For those who have programmed before think of this as a clever array. Thankfully they have made this easy in Microsoft Fabric.
Instructions
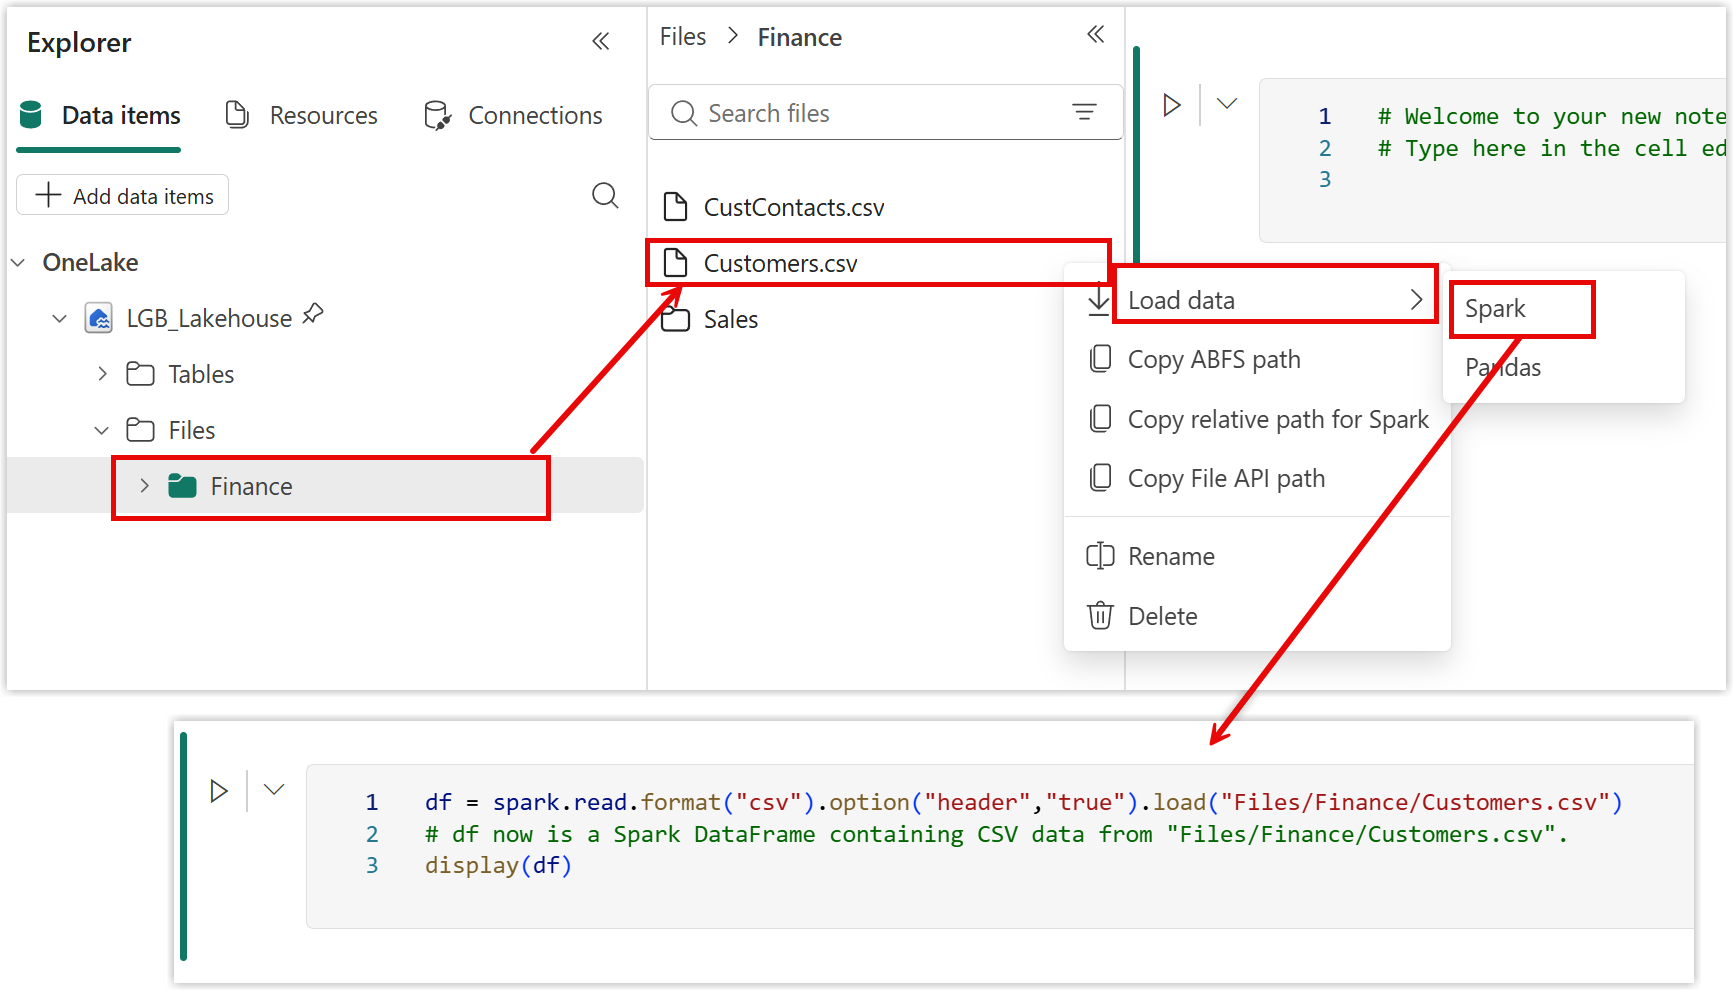
- Expand the lakehouse in the explorer pane to find the customers file
- Click on the three dots next to the file and select Load data
- Select Spark
This will create your first code block.
Executing the code
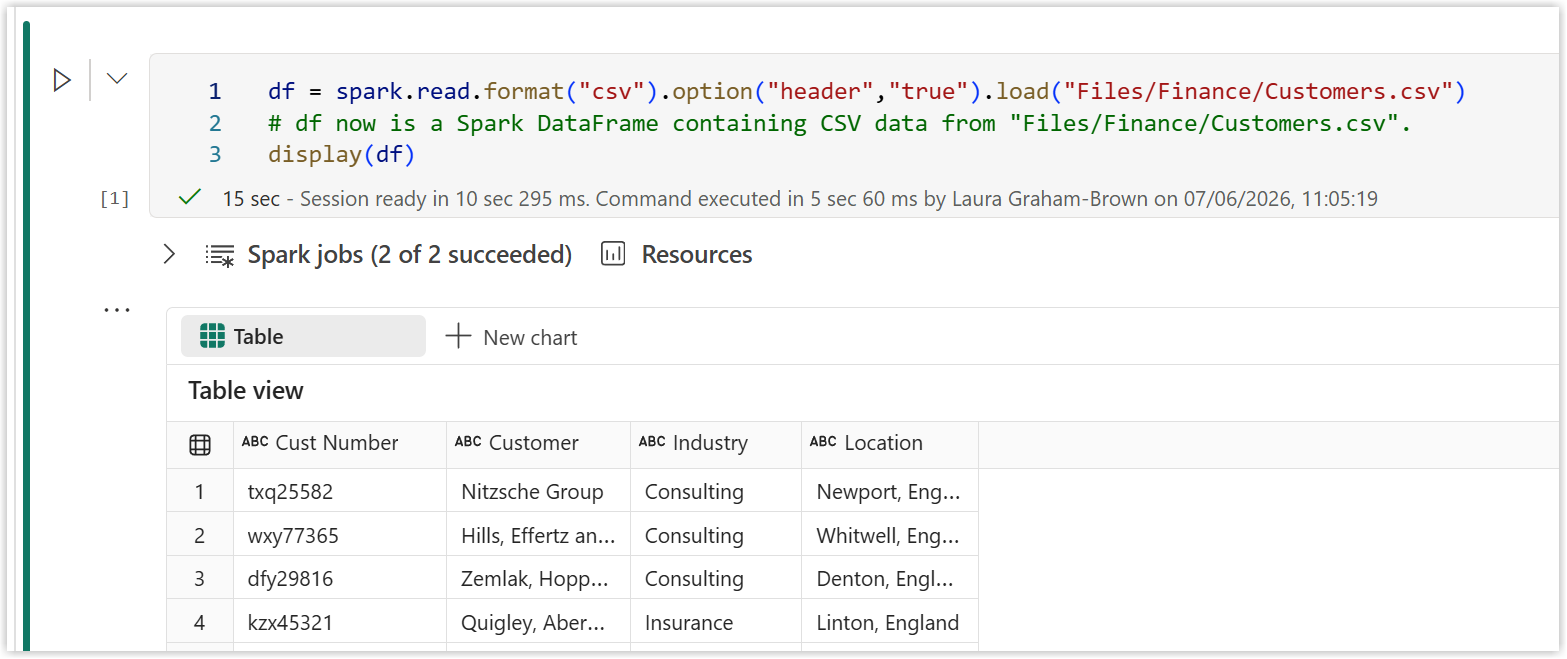
Now we have our first code block we can run that block. Click on the arrow next to the code block. It will have to start a spark session so the first time it runs it will take a moment.
Data Wrangler
The csv gives us 4 columns of data. The first column Cust Number we probably want to remove that space in the name and Location should be split into 2 columns rather than 2 values split by commas. These aren't hard tasks to code but lets use Data Wrangler to show use how.
Instructions
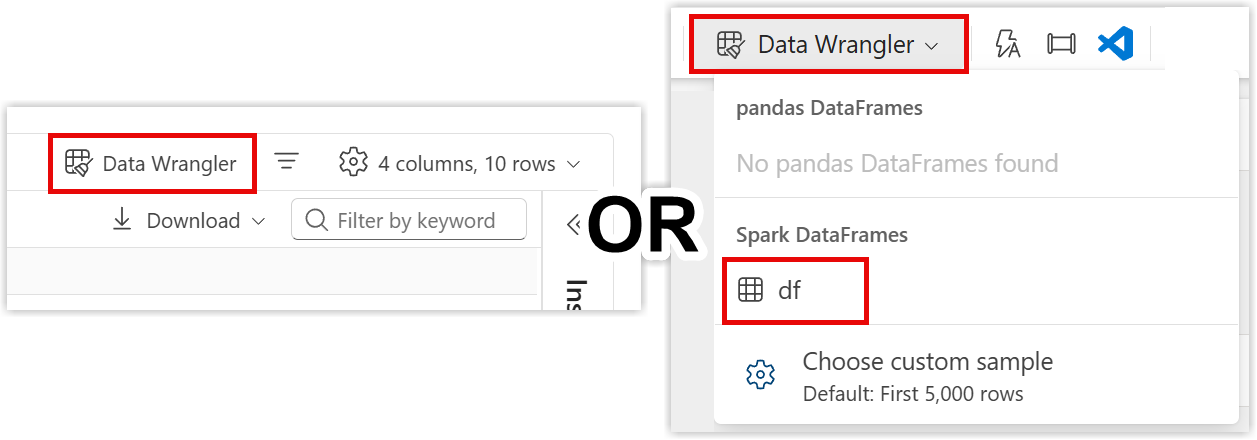
- At the top of the datafram displayed from running code, select Datawrangler
- OR on the top ribbon click on Data Wrangler and then from the Spark Dataframes click on df.
Note
Datawrangler needs the dataframe to have been created so you will always need to execute the code to populate the dataframe first.
Rename a column
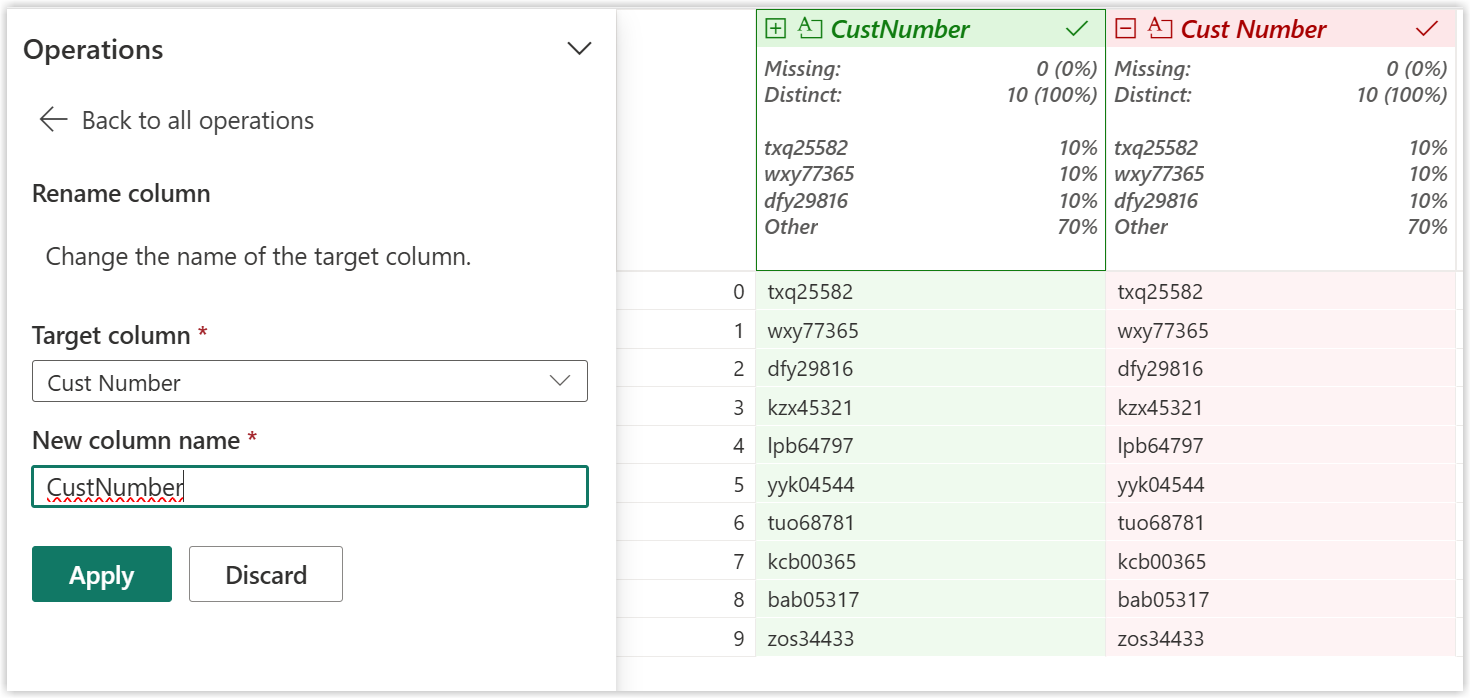
The first transformation we will do is rename the Cust Number column to remove the space from the name. Data wrangler will write the code for this
Instructions
- Either right click on the column header or click on the three dots next the column name.
- Select rename column
- In the Operations pane type in the new name
- Compare the red version to the green version, ie the before and after versions.
- When you are satisfied, click apply
Previewing Step Code
At the bottom of the screen there are two panes, Cleaning steps and a code window. The step we just added is called Rename column. If you click on that step you will see the code that is behind it. Data wrangler writes in Panda but will convert to PySpark when you finish. You can only delete the last step in the series.

Column by Example
The next transformation is to change the Location column into a City and Region column. There are multiple ways to do this. For this lab we are going to use column by example. This feature allows you to enter example answers and it calculates the code. Power Query has a very similar feature column by example.
Instructions
- Make sure New operation is selected in the cleaning steps
- In the Operations pane select New column by example
- In the Columns to derive from, select Location
- For the Derived column name, put in City
- When the green column appears, enter in the value you want it to be, e.g. Newport
- Press enter and wait a moment. It will work out yu want the text before the comma
- When you are happy with the answer, click Apply.
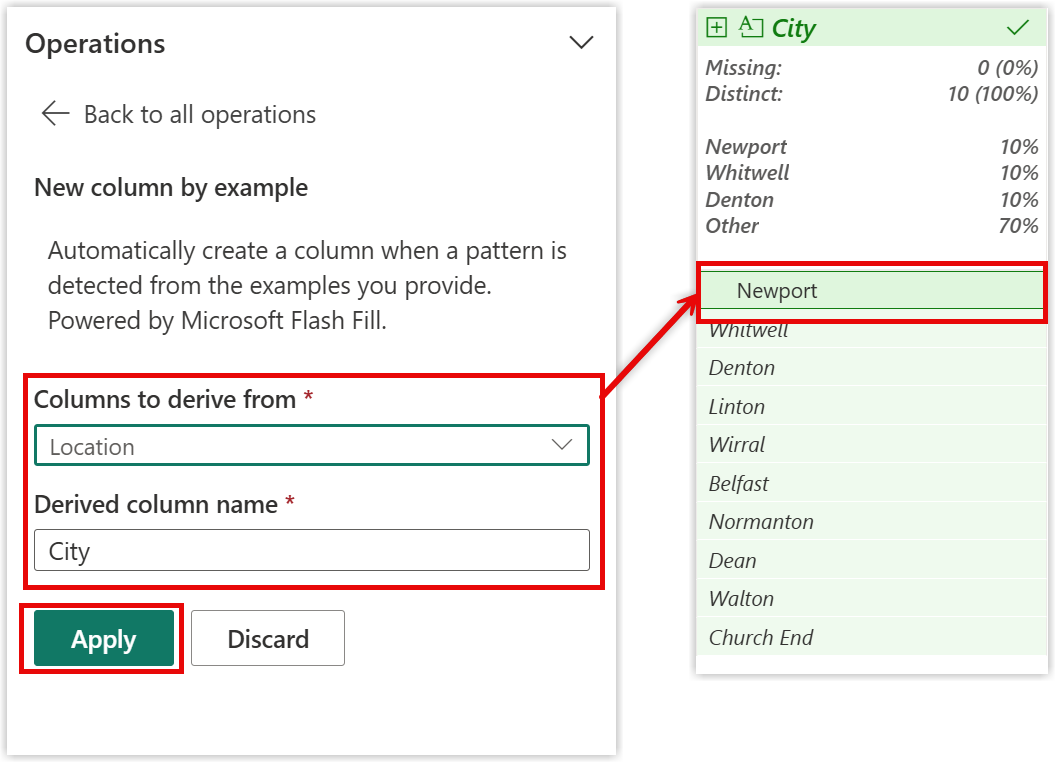
Data wrangler will try its best to work out from the example answers added in to determine the right code. No AI credits are being used I promise.
Instructions
- Repeat the above steps to extract the Region from the Location column.
Note
There are multiple ways we could have performed the above steps. There is a split column operation that could have been used. This is a great way to learn some python.
Remove the Location Column
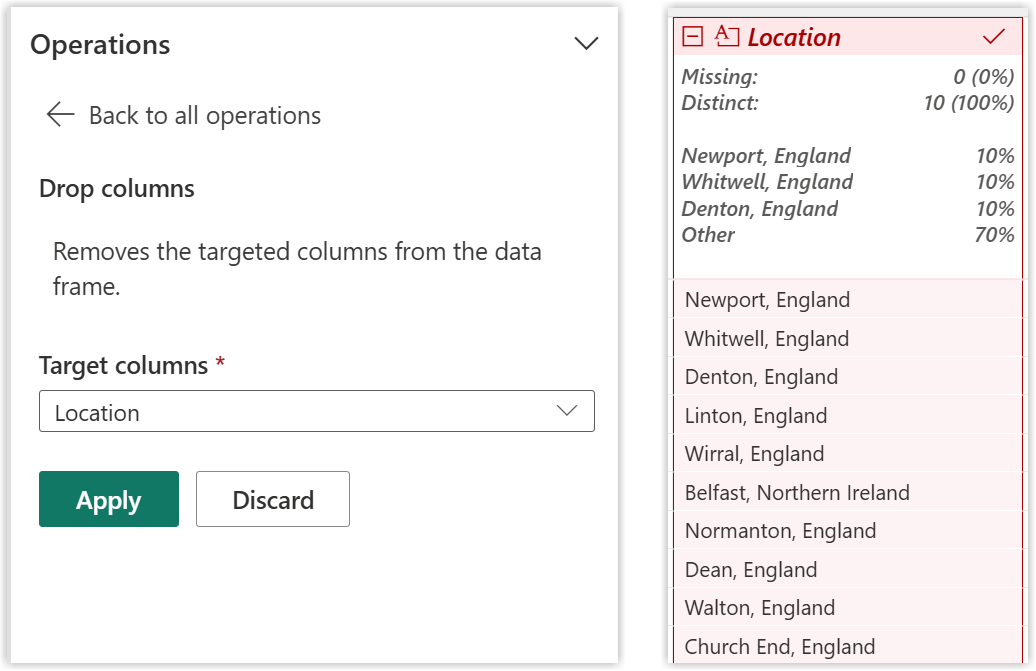
The last cleaning action we need to do is remove the Location column as we no longer need it.
Instructions
- Right click or select the three dots on the Location column.
- From the menu select Drop columns.
- The Location column will now be highlighted red. The Operations pane will now show a drop down for target columns, more columns could be selected.
- Click Apply to remove the Location column.
Add Code to Notebook
We have completed all the transformation steps. Now we are ready to copy the code back into our notebook. Click on Add code to notebook at the top of the screen. A dialog will show you a preview of the code. Click Add and it will add a new code block to your notebook.
Instructions
- Click on Add code to notebook at the top of the screen.
- Check the dialog that shows you a preview of the code.
- Click Add
- Execute the newly added code
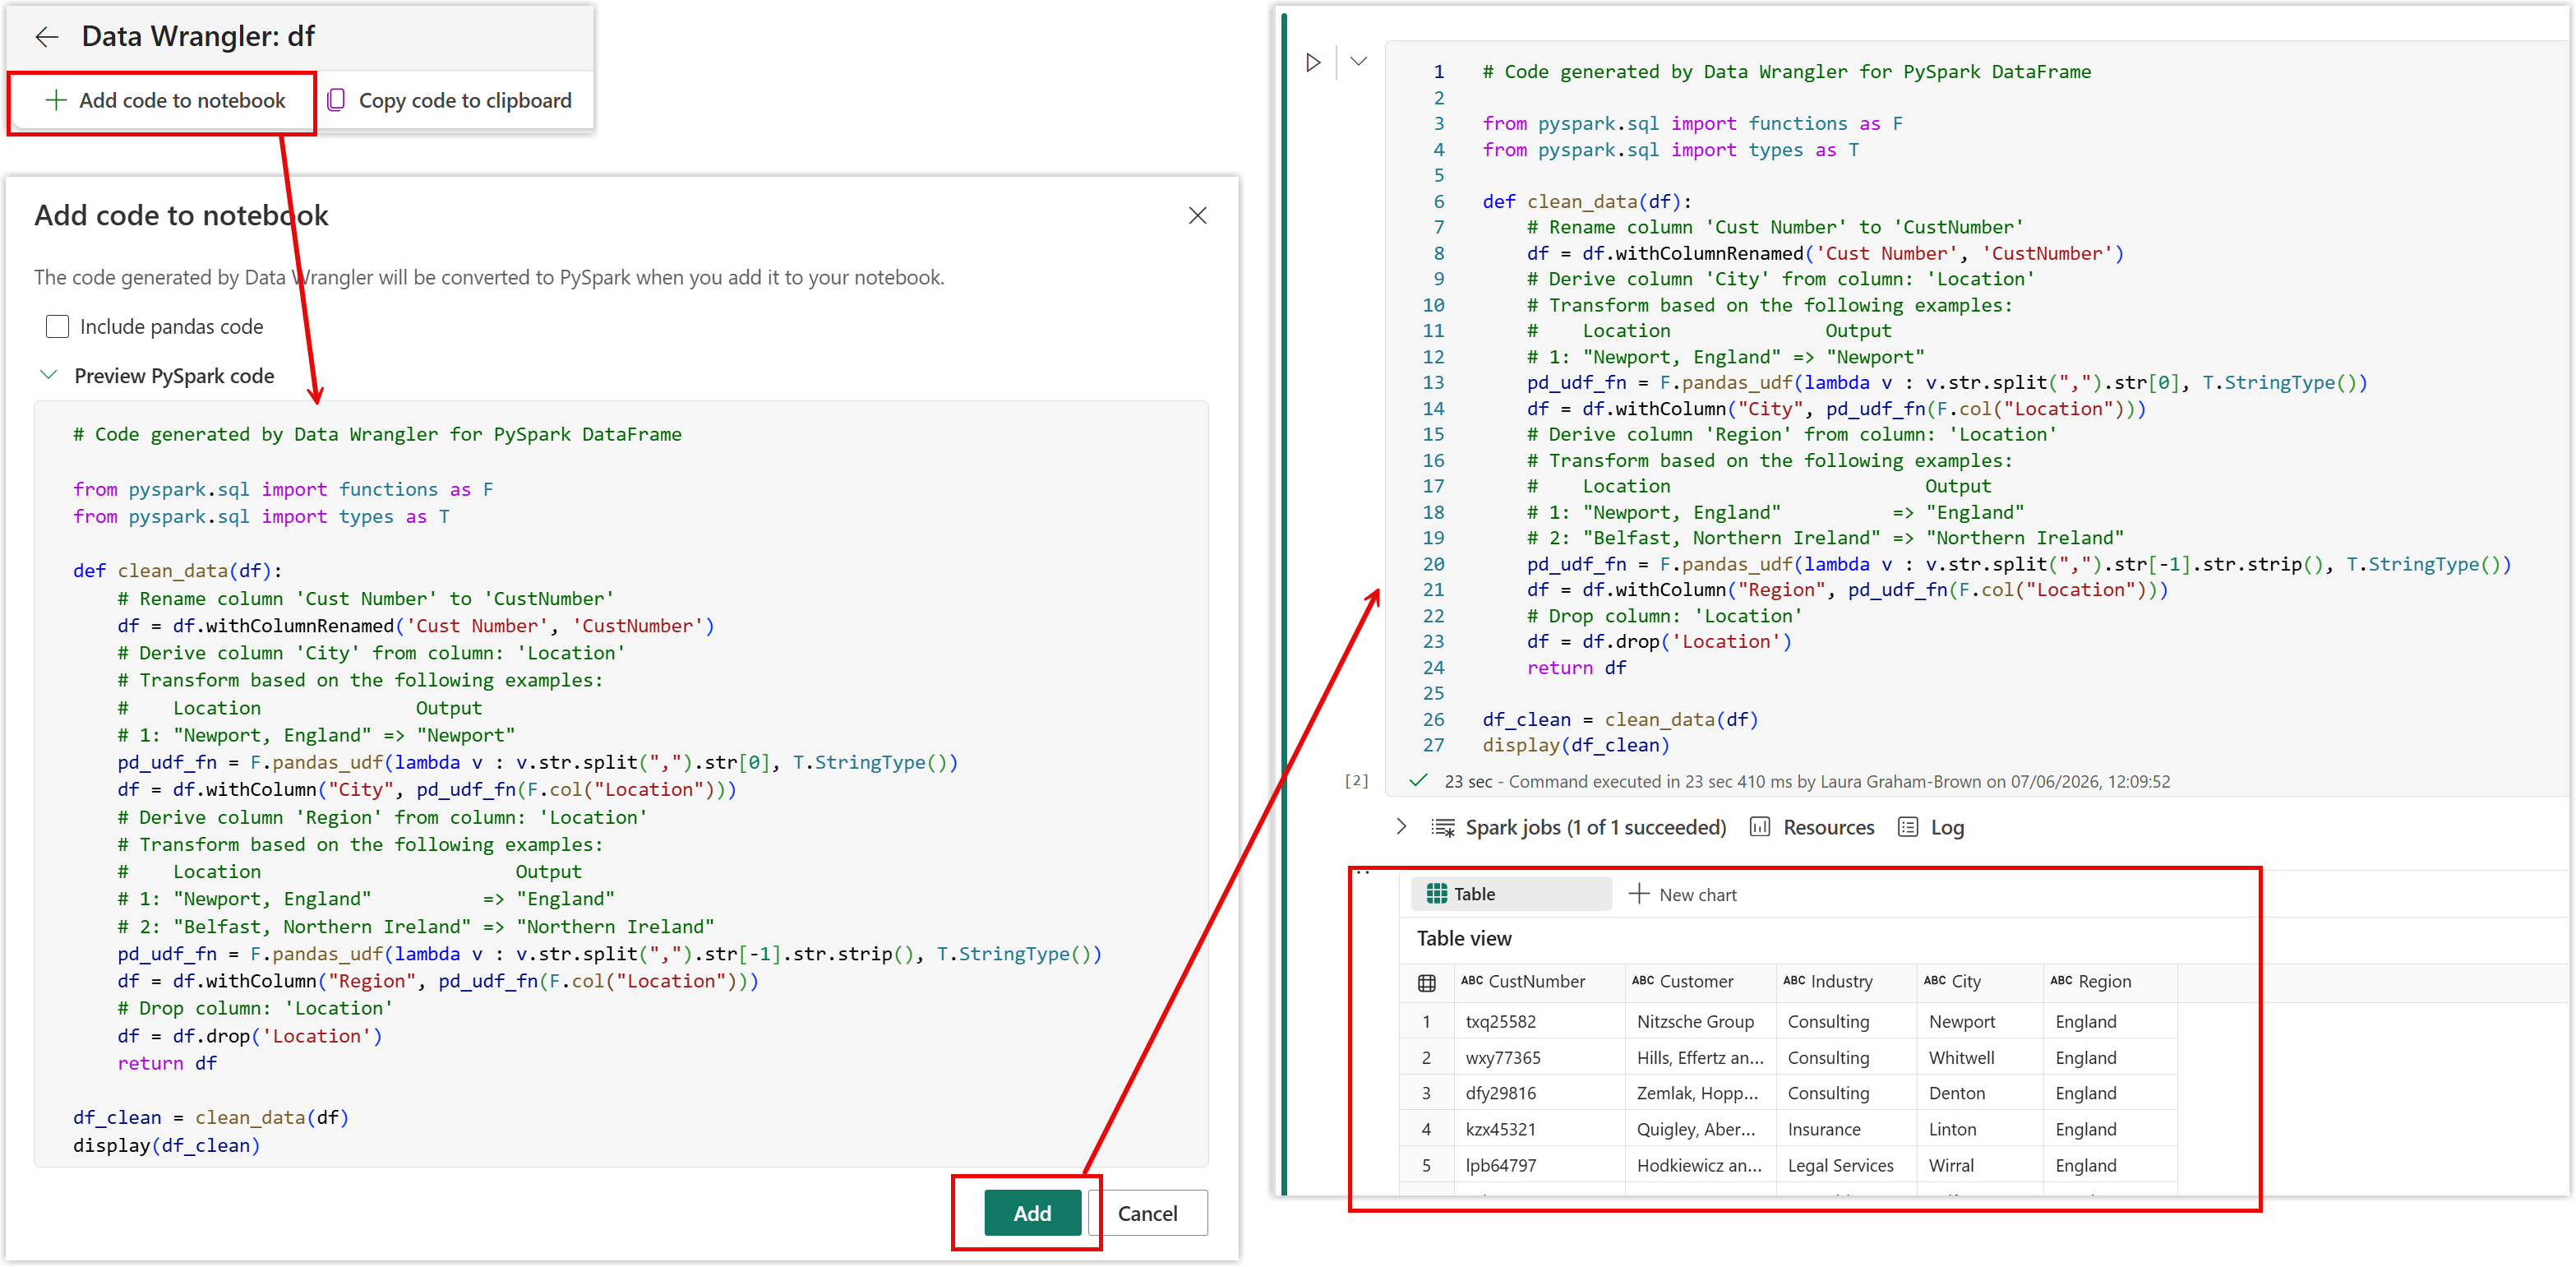
The code has created a function called clean_data to perform the steps we specified. the last 2 lines of the code block creates a new dataframe called df_clean by running that function on the dataframe df. And then displays the results.
Note
Data wrangler is a one off create code. It cannot be relaunched to edit the operations.
Extended Topic
For coders, data wrangler is a great way to learn techniques on transforming data. I've extracted snippets of code into a code block and worked from there. If you are new to coding this something to try when you feel more comfortable.
Extended Topic
- Examine the code and what snippets could you learn?
- Could you simplify the code?
Simplified version
This code is copied out from the function and does the changes directly to the df dataframe.
# Rename column 'Cust Number' to 'CustNumber'
df = df.withColumnRenamed('Cust Number', 'CustNumber')
# City = Location before the comma
pd_udf_fn = F.pandas_udf(lambda v : v.str.split(",").str[0], T.StringType())
df = df.withColumn("City", pd_udf_fn(F.col("Location")))
# Region = text after , minus one space
pd_udf_fn = F.pandas_udf(lambda v : v.str.split(", ").str[1], T.StringType())
df = df.withColumn("Region", pd_udf_fn(F.col("Location")))
# Drop column: 'Location'
df = df.drop('Location')

display(df)
Save the data to a table
The final step of this notebook to write this data to a table. This is the one line of code you have to write, but you can copy and paste from below.
df_clean.write.mode("overwrite").format("delta").option("overwriteSchema", "true").save("Tables/dbo/Customer")The mode being overwrite and the option to overwrite the schema means that this notebook will overwrite anything already there. The delta format is the format for tables in Microsoft Fabric. The final part shows the path to the table.
Run this code block to save the dataframe. Or click Run All to execute all blocks.
View table in Lakehouse
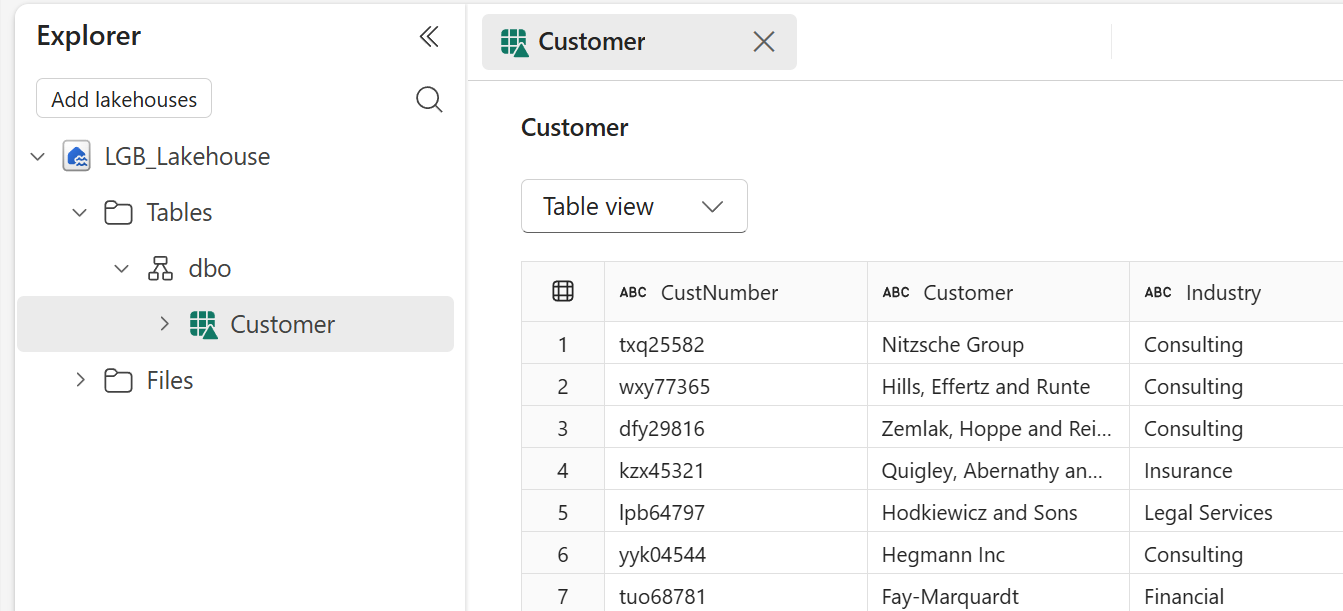
Once the code has run the next step is to confirm that the table has been created.
Instructions
- Return back to the workspace
- Open the lakehouse
- Expand Tables and dbo
- If nothing shows click on the three dots on Tables and click Refresh
- Click on the Customer table to see the data
Lab Complete
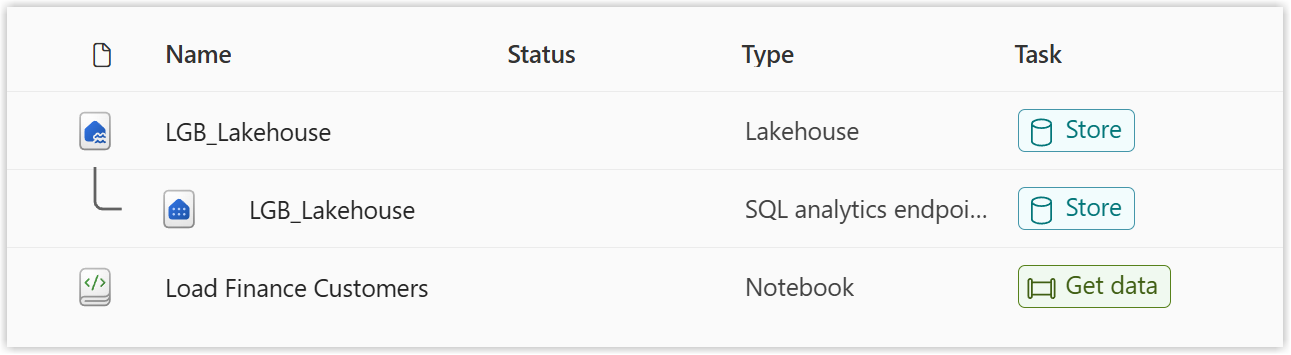
Once this lab is complete you should have a Lakehouse with an SQL Endpoint and a Notebook.