25th March 2020 Power BI – Introducing the Hierarchy Slicer 
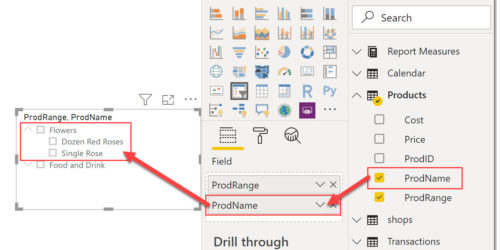
The new hierarchy slicer allows for data to be sliced based on different levels. This will reduce the number of slicers required on a report page. Categories Power BI/How to
9th March 2020 Power BI – Reset Slicers with a Bookmark Button When your report has a bunch of slicers and charts that can also add filters to the page resetting back to no filters can be painful. So we need a quick way to reset slicers. This post walks through the steps of creating a bookmark and the using that bookmark to reset the page by clicking a button. Introduction This... Categories Power BI/Introduction
6th March 2020 Power BI – Slicers Introduction Power BI reports can be made more flexible using simple slicers to allow your report consumers to slice and dice the data shown. Categories Power BI
21st January 2020 Power BI – Connecting to Project Online This post walks through connecting to Project Online to visualise the data in Power BI. This is the first post in a series of building a set of reports. Categories Power BI/Project
6th October 2019 Power Query Functions – SQL Procedures This is the fourth post in my series regarding writing custom functions in Power Query. This post describes how to create a function that will execute an SQL procedure, passing in a parameter. Stored Procedure My database contains a very simple procedure that given a cost center returns all the expense records. It can be run with the following SQL... Categories Power BI/M/Power Query
5th October 2019 Power Query Functions – Fetch web data Often web based data is split across multiple pages. This post describes how to use a function to fetch web data from multiple pages by using parameters. Categories Power BI/M/Power Query
13th August 2019 SVG in Power BI Part 7 – Using a Theme File to add SVG Icons As part of the July 2019 update there were changes to conditional formatting. In this post I am going to cover adding to or swapping the built in icons using a theme file and some SVG. Categories Power BI/SVG/Updates
6th August 2019 SVG in Power BI Part 6 – New Icon Conditional Formatting In July 2019 Power BI Desktop update they included new conditional formatting on table and matrix to include icons. These icons can be defined using SVG which is pretty cool. So this is a new post in my Power BI SVG series looking how we can use SVG icons in conditional formatting. Categories Power BI/SVG/Updates
9th July 2019 Power BI – Data Refresh Date In this quick post I will walk through adding a data refresh date on a report page in Power BI. Categories Power BI/How to
13th June 2019 Power BI – Conditional Formatting Update The June 2019 update for Power BI included a few updates for conditional formatting, for visual backgrounds, titles, cards and gauges. This post is my take on the updates and on how I prefer to do the logic behind choosing a colour. Full details of the June 2019 update can be found at https://powerbi.microsoft.com/en-us/blog/power-bi-desktop-june-2019-feature-summary/ Applying Conditional Colour Formatting This update... Categories Power BI/Updates