Series
This is part of a series on using SVG in Power BI. The series supports my session at Power BI Days in Mechelen, Belgium in April 2019.
- Introduction to SVG Basics
- KPI Shapes in Power BI
- Filling up with colour using SVG in Power BI
- Using Text in SVG
- Using SVG Rotate to create a dial in Power BI
- SVG Icons in Conditional Formatting
- Using a Theme to add SVG Icons
- Feb 2023 Update - 5 SVG Stars
In July 2019 Power BI Desktop update they included new conditional formatting on table and matrix to include icons. These icons can be defined using SVG which is pretty cool. So this is a new post in my Power BI SVG series looking how we can use SVG icons in conditional formatting.
Quick Overview of Icon Conditional Formatting
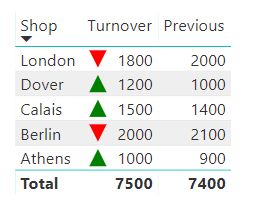
Once you have added a table or matrix visual to your report you can in formatting in the Conditional Formatting Section turn on Icons. This will immediately add icons to the selected column. In the example below icons were added to Turnover column.
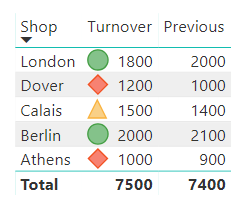
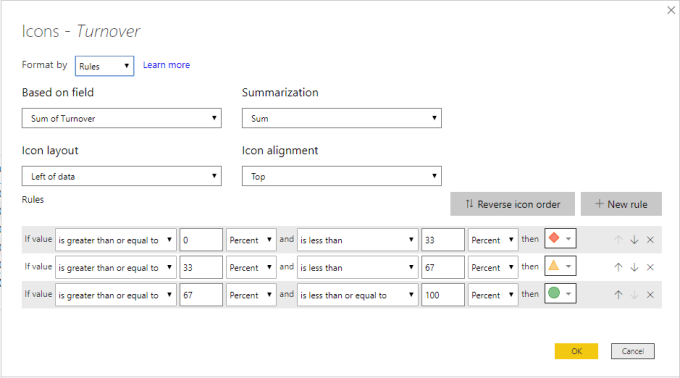
Clicking on Advanced controls link opens options behind the selection of icons. The default rules are for 3 icons at
In this post though I’m looking at using SVG to define and select the icon. So I will not be using rules but will be using a measure. The example is going to be based on a measure written in a previous post, KPI Shapes in Power BI The measure decides on an up or down arrow based on another measure called Growth.
| |
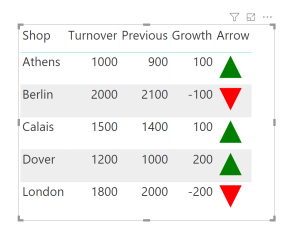
The arrow is in its own column and doesn’t resize with font sizes. With the Icon update we can add the icon to any column.
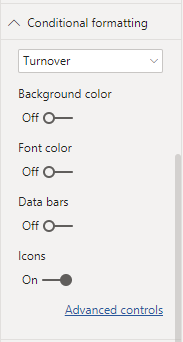
Select your table visual
In visual format, expand Conditional Formatting
Select the column and turn on Icons
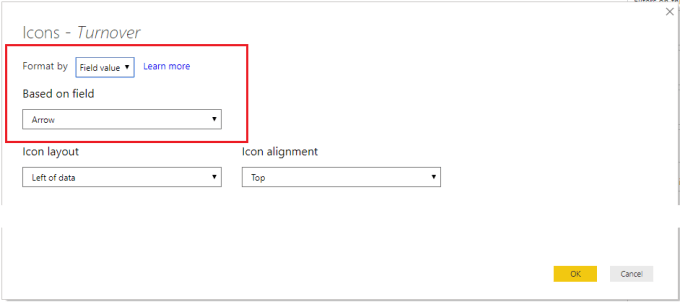
Click on Advanced Controls
Change Format to Field Value
Change Based on Field to the measure, eg Arrow
Click OK
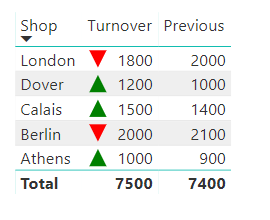
Conclusion
Icons update is an exciting one and much needed. It cuts out the need for SVG for many, which is great. Now with a little SVG we can add some conditional formatting without having to add the extra column.