SVG in Power BI – Part 4 – Adding SVG Text
Series
This is the fourth post in my series on using SVG in Power BI introducing adding SVG text and actually solves one of the niggles I had with doing KPI figures in Power BI. I didn’t get to do this part as part of my session which started this series. Here is the list of posts.
- Introduction to SVG Basics
- KPI Shapes in Power BI
- Filling up with colour using SVG in Power BI
- Using Text in SVG
- Using SVG Rotate to create a dial in Power BI
- SVG Icons in Conditional Formatting
- Using a Theme to add SVG Icons
- Feb 2023 Update – 5 SVG Stars
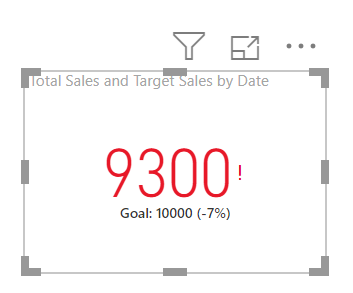
My niggle was the KPI visual. It is a fast way to have a red or green measure displayed. BUT, it requires a trend axis even if you don’t want one and it includes a tiny red exclamation mark or green tick. So I wanted the red / green and the goal shown with no trend or ticks and exclamation marks.
Simple Text Element
SVG Text elements need an x and y attributes to position the text and a style attribute that uses CSS notation to choose font properties. The example below has the word Hello where the bottom lower left corner is at 20,60.
Text Measure =
// svg essentials
    var svg_start = "data:image/svg+xml;utf8,<svg xmlns='http://www.w3.org/2000/svg' viewBox='0 0 100 100'>"
    var svg_end = "</svg>"
// text element including a style tag
    var svg_text ="<text x='20' y='60' style='font:normal 20px sans-serif;'>Hello</text>"
return
    svg_start & svg_text & svg_end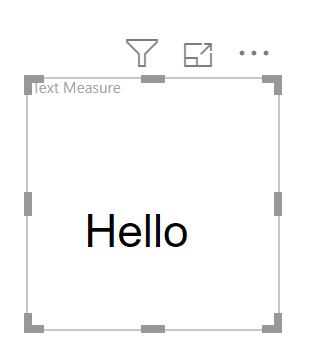
Aligning SVG Text
If I am going to replace the KPI visual I need to place a number centred in the SVG graphic. The default alignment is the x and y are the bottom left. This can be changed using the text-anchor attribute for the text element; it can be set to start, middle or end.
Below is an example of the string ABC being aligned start, middle and end.
Text Measure =
// svg essentials
    var svg_start = "data:image/svg+xml;utf8,<svg xmlns='http://www.w3.org/2000/svg' viewBox='0 0 100 100'>"
    var svg_end = "</svg>"
// text element including a style tag
    var svg_text1 ="<text x='50' y='20' style='font:normal 20px sans-serif;' text-anchor='start'>ABC</text>"
    var svg_text2 ="<text x='50' y='50' style='font:normal 20px sans-serif;' text-anchor='middle'>ABC</text>"
    var svg_text3 ="<text x='50' y='80' style='font:normal 20px sans-serif;' text-anchor='end'>ABC</text>"
return
    svg_start & svg_text1 & svg_text2 & svg_text3 & svg_end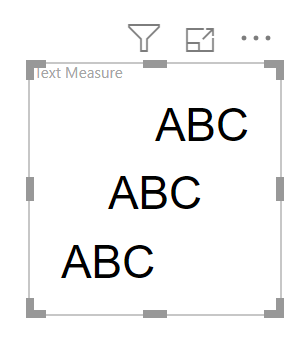
My KPI Visual
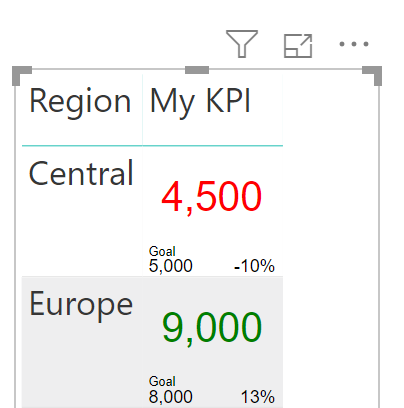
To replace the KPI shown at the start of this post I want a number in the middle of the square showing the measure, bottom left the goal and bottom right how close to the goal we were.
My KPI =
// svg essentials
    var svg_start = "data:image/svg+xml;utf8,<svg xmlns='http://www.w3.org/2000/svg' viewBox='0 0 100 100'>"
    var svg_end = "</svg>"
// 3 text elements, actual, goal and % close
    var svg_Indicator ="<text x='50' y='50' style='font:normal 35px sans-serif;' text-anchor='middle'>"
                        & FORMAT([Total Sales],"#,##0") & "</text>"
    var svg_goal =  "<text x='0' y='90' style='font:normal 10px sans-serif;' text-anchor='start'>Goal</text>"
                    & "<text x='0' y='98' style='font:normal 10px sans-serif;' text-anchor='start'>"
                        & FORMAT([Target Sales],"#,##0") & "</text>"
    var svg_close ="<text x='100' y='98' style='font:normal 10px sans-serif;' text-anchor='end'>"
                        & FORMAT([KPI Close],"0%") & "</text>"
return
    svg_start & svg_Indicator & svg_goal & svg_close & svg_end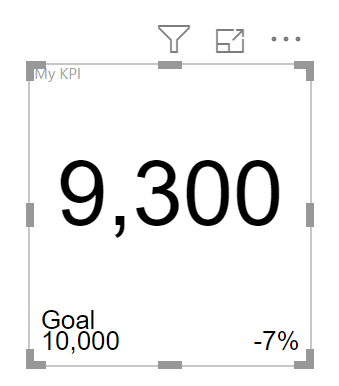
Format function is used to format the number into comma, #,##0 and percent, 0% formats.
The last part is to colour the number based on the Indicator reaching the target. This was covered in Part 2 of this series so I’ll just give the final code.
My KPI =
// svg essentials
    var svg_start = "data:image/svg+xml;utf8,<svg xmlns='http://www.w3.org/2000/svg' viewBox='0 0 100 100'>"
    var svg_end = "</svg>"

// calculate colour for element
    var ind_colour = IF([Total Sales]<[Target Sales],"Red","Green")

// 3 text elements, actual, goal and % close
    var svg_Indicator ="<text x='50' y='50' style='font:normal 35px sans-serif;' text-anchor='middle'
                            fill='" & ind_colour & "'>"
                        & FORMAT([Total Sales],"#,##0") & "</text>"
    var svg_goal =  "<text x='0' y='90' style='font:normal 10px sans-serif;' text-anchor='start'>Goal</text>"
                    & "<text x='0' y='98' style='font:normal 10px sans-serif;' text-anchor='start'>"
                        & FORMAT([Target Sales],"#,##0") & "</text>"
    var svg_close ="<text x='100' y='98' style='font:normal 10px sans-serif;' text-anchor='end'>"
                        & FORMAT([KPI Close],"0%") & "</text>"
return
    svg_start & svg_Indicator & svg_goal & svg_close & svg_end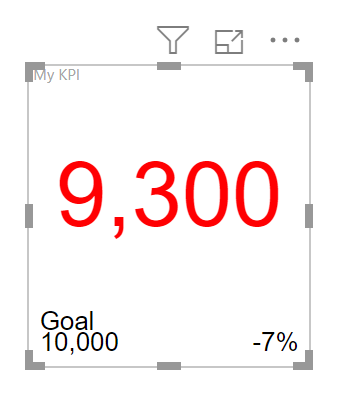
My KPI in a Table
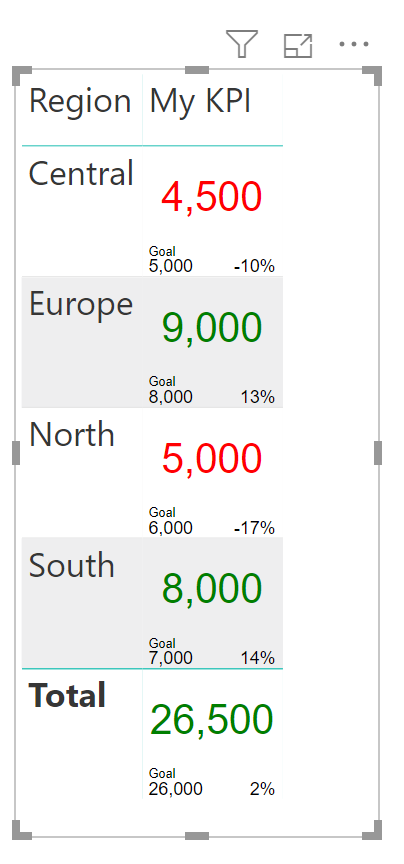
One advantage of the SVG text KPI over the KPI visual is it can be embedded within a table. The total line will work as long as the number measures work.
Conclusion
Adding SVG text to a visual does make the visual more informative and the above example makes conditional formatting and data layout possible in a table.
More Power BI Posts
- Conditional Formatting Update
- Data Refresh Date
- Using Inactive Relationships in a Measure
- DAX CrossFilter Function
- COALESCE Function to Remove Blanks
- Personalize Visuals
- Gradient Legends
- Endorse a Dataset as Promoted or Certified
- Q&A Synonyms Update
- Import Text Using Examples
- Paginated Report Resources
- Refreshing Datasets Automatically with Power BI Dataflows
- Charticulator
- Dataverse Connector – July 2022 Update
- Dataverse Choice Columns
- Switch Dataverse Tenancy
- Connecting to Google Analytics
- Take Over a Dataset
- Export Data from Power BI Visuals
- Embed a Paginated Report
- Using SQL on Dataverse for Power BI
- Power Platform Solution and Power BI Series
- Creating a Custom Smart Narrative
- Power Automate Button in a Power BI Report