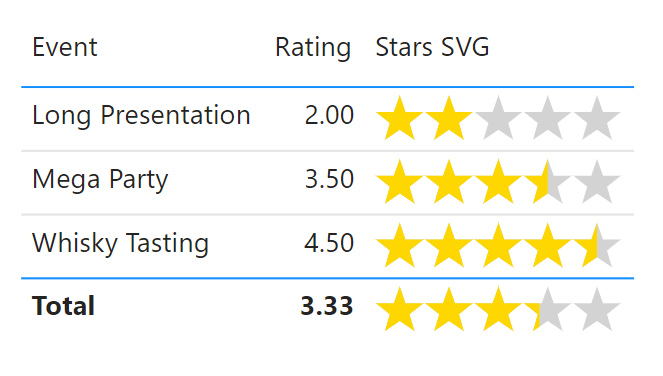
In the Feb 2023 Power BI Update they introduced image width in a table formatting. This means SVG images now don’t have to be square, so we can now do rectangle images. So I ported Stars SVG code I had in my Power Apps series and added this post to my Power BI SVG series
Series
This is part of a series on using SVG in Power BI. The series supports my session at Power BI Days in Mechelen, Belgium in April 2019.
- Introduction to SVG Basics
- KPI Shapes in Power BI
- Filling up with colour using SVG in Power BI
- Using Text in SVG
- Using SVG Rotate to create a dial in Power BI
- SVG Icons in Conditional Formatting
- Using a Theme to add SVG Icons
- Feb 2023 Update - 5 SVG Stars
For this post we are using a table of events that have a rating score. I want to add a visual version of the rating to the table visual.
Resources for this post and video can be found at https://github.com/Laura-GB/DemoData/
YouTube Version
Draw 1 Star SVG
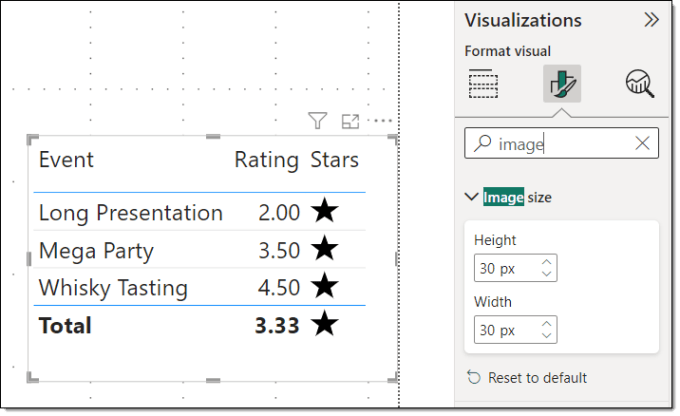
The first step is a measure to draw a single star. That starts with the SVG essentials similar to previous examples and the basic star shape. We need to remember to change Data Category the measure is an Image URL under data category and then add it to the table
| |
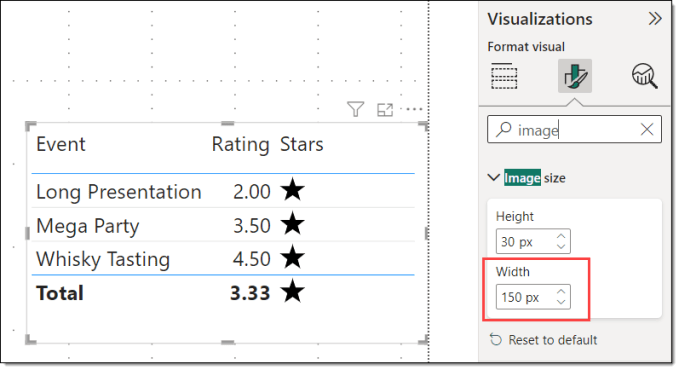
The default image size will be too big. In the formatting for the table, change the image size. I’ve used 30 px, pick a size that works for you.
Draw 5 Stars SVG
In order to draw 5 stars in a row the view box needs to be expanded to fit them all in. So the svg_start needs to change to 500 100. This will mean that the above width will also need to change. One star is 30 px, so 5 stars will need a width of 150 px.
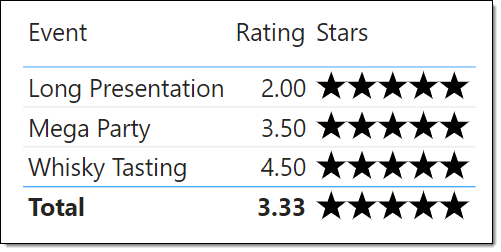
Then we need to draw 5 stars in a row. We can use GENERATESERIES to create a table with numbers 0,100..400 so we can draw a star at 0,0 and 100,0 etc. That can be used inside a CONCATENATEX to create 5 groups. Each group will use a transform, translate to position each star.
| |
Grey Star Outlines
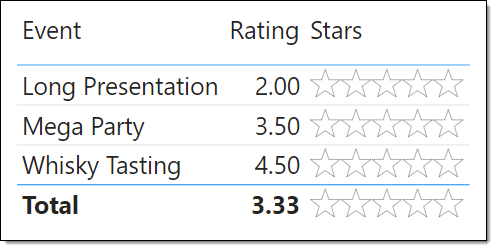
The first layer of stars is outline stars so we need to put the 5 stars in a group with a white fill and 1 point black outline.
| |
Define Clip Path
The gold stars need clipping to match the rating score. 5 stars is 500 wide so a rating of 2 needs the gold stars clipped at 200, and 3.5 at 350 etc. We use variable ClipWidth to store this. To clip an image we use the and tags. The clipPath includes an id so it can be used later. The clipped area is a rectangle from with a height of 100 and a width of ClipWidth.
| |
Draw Clipped Gold Stars
The last step is to draw the 5 gold stars using the clip path. So we use another group, apply a fill of gold and the clip path. The clip path name
| |
Conclusion
The width addition to images in tables and matrix opens up lots of possibilities to use images in tables. There are lots of ideas for visuals to add to a table or matrix.Kerry Kolosko has some brilliant templates to get you started at https://kerrykolosko.com/portfolio/