Series
This is part of a series on using SVG in Power BI. The series supports my session at Power BI Days in Mechelen, Belgium in April 2019.
- Introduction to SVG Basics
- KPI Shapes in Power BI
- Filling up with colour using SVG in Power BI
- Using Text in SVG
- Using SVG Rotate to create a dial in Power BI
- SVG Icons in Conditional Formatting
- Using a Theme to add SVG Icons
- Feb 2023 Update - 5 SVG Stars
In this post I will show to use SVG to create simple KPI Indicators. In this example I have very simple data of a list of 5 shops with Turnover and Costs. I have added a measure for Profit Margin as a percentage.
Create SVG Measure
We shall start with a simple SVG image of a dot and show how to create an SVG measure to use in a table.
- Create a measure to store the SVG in a string.
| |
- Prefix the SVG with code to declare that it is an SVG image.
| |
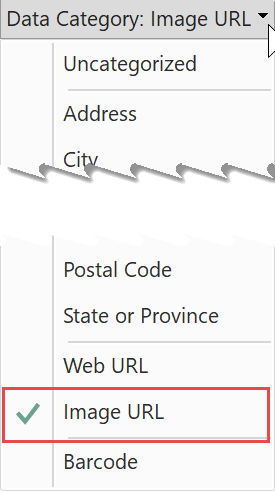
- On the Modelling ribbon tab, change the measure’s data category to Image URL.
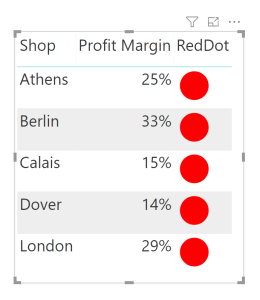
- Insert measure into a table. You will need to turn off the totals to make the total line not show svg code. I will fix this in a later post.
Change to be Reactive
The above example puts a red dot on every line. We will now adapt the measure to change the colour depending upon the measure Profit Margin measure to make this into a KPI shape.
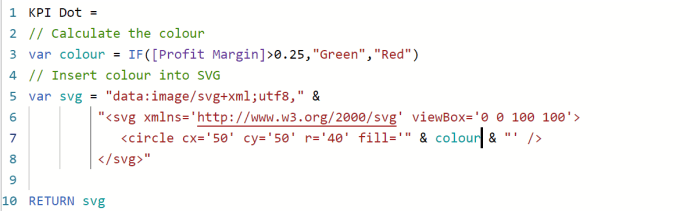
We use a variable to store the colour and its value comes from an IF statement.
We insert the colour into the SVG statement
We return the SVG
| |
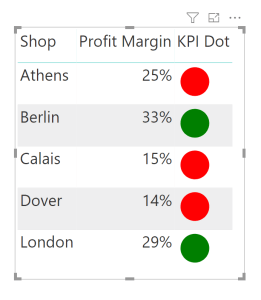
Up and Down Arrows
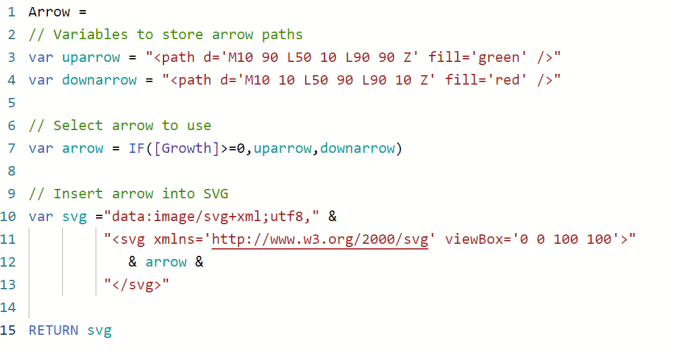
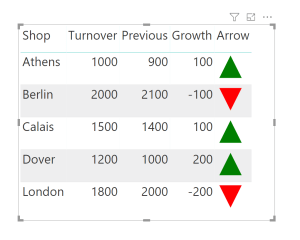
The above example changed a colour which is okay but it would be better if we could also change the shape of the icon. For this example I use another measure of Growth which compares Turnover to previous turnover. If the Growth is positive I want to display a green up arrow and if negative a red down arrow.
Set up variables for an up and down arrow
Select which arrow to use
Insert the arrow into the svg
Return the svg.
| |
Conclusion
This gives an introduction of using SVG within Power BI to create KPI shapes. There is lots more that could be done with SVG and this series will continue to add more features using svg.