Recently in a few Power BI projects and training courses we’ve needed to create a measure for counting active records based on start and end dates for a time period. This has varied from active projects, active employees to active contracts. All of them have had the common feature of start and end dates.
Scenario
| Task | Start | End |
|---|---|---|
| A | 01-May | 20-May |
| B | 15-May | 15-Jun |
| C | 5-Jun | 25-Jun |
| D | 20-Jun | 20-Jul |
| E | 10-Jul | 25-Jul |
| F | 25-Jun | 15-Jul |
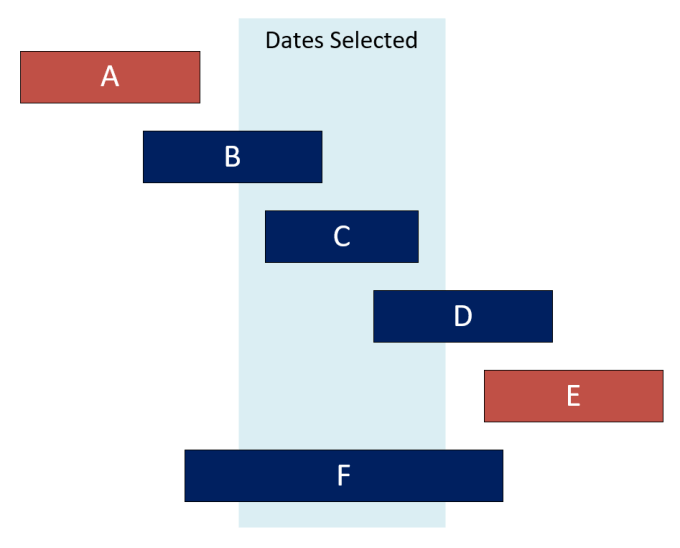
We have 6 tasks A-F. We want to know how many tasks are active in June. In the list in table above and shown in the image the 2 that don’t count are task A, that finishes before June starts and task E that starts after June finishes. I have a separate calendar table called Calendar.
Understanding the logic of the filters needed is important when writing a measure. For a task to be active in a period, the task must finish after the start of the period and the task must start before the period ends.
DAX Code for counting Active Records
In DAX we are going to use CALCULATE function to apply the above filters. _MinDate and _MaxDate give us the start and end of the period.
| |
This code does not rely on any relationships between the tasks and calendar tables. If there is a relationship that is altering the calculation a CROSSFILTER function can be used to set the relationship to None.
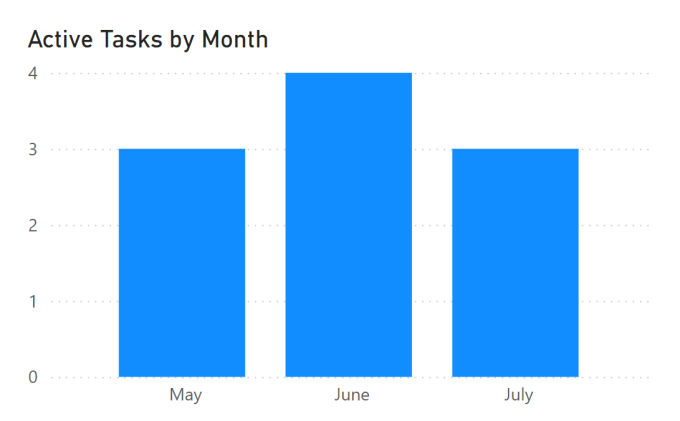
It can be used in a chart to show 3 active tasks in May, 4 in June and back to 3 in July.
This is a simple example of using CALCULATE and creating a useful measure. One I’ve taught a few times and promised to document.
Resources
Conclusion on Counting Active Records
Yes this is another post on me being lazy to answer a question I end up answering lots. Understanding how you can use CALCULATE and how to work out the right filters for your logic is the crux of understanding quite a bit of DAX. Something I am still learning every day still working on.