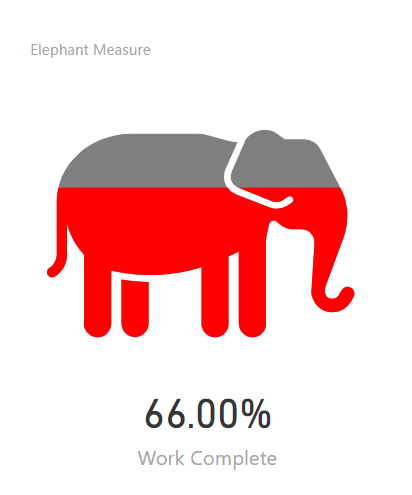
In this post we will introduce using SVG icons and filling the icon with colour to show a percentage value.
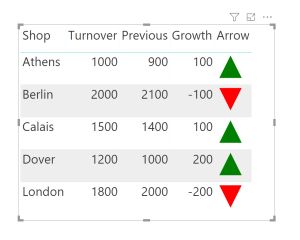
This is the second post in a series of Using SVG within Power BI and introduces shapes to create KPI graphics.
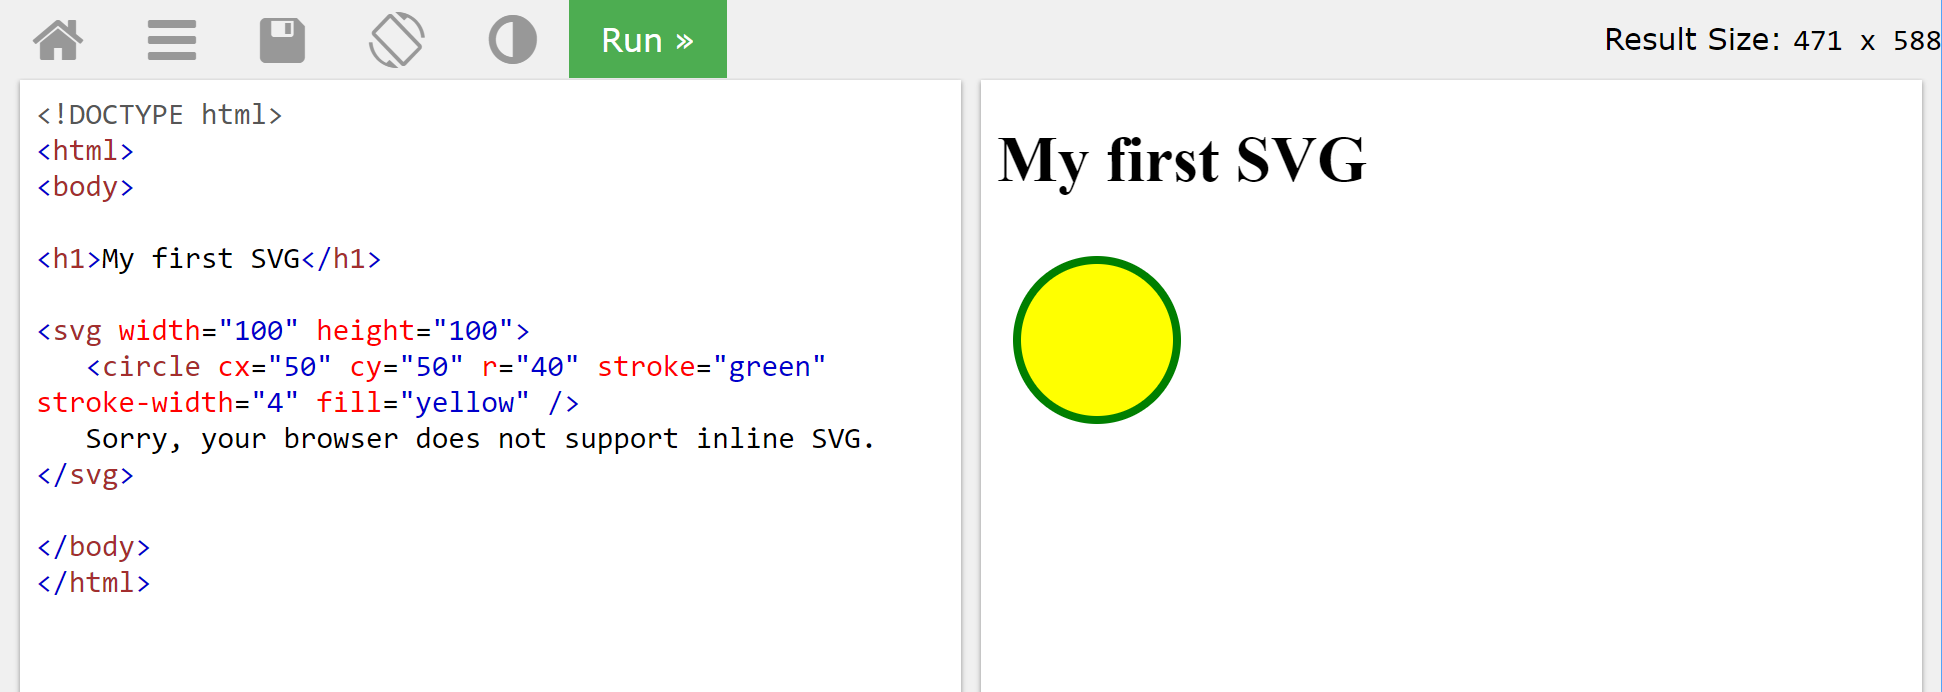
Quick introduction to SVG to prepare for using SVG in Power BI and PowerApps.